
Offshore wind can soar once choppy waters calm
Impax Asset Management
Authors: William Grey, Charlie Donovan, Harry Boyle
Dislocation in the offshore wind market creates investment opportunities.
Has the offshore wind energy’s ascent been blown off course? Behind the headlines of cancelled projects, there remains a growing industry that generates clean electricity at scale and competitive cost. While recent challenges have crimped margins – and share prices – offshore wind will still have a central role in modernising the global energy system.
Under the IEA’s net-zero roadmap, new offshore wind capacity must rise nearly tenfold from now until 2030.1,2 As the country with the second greatest installed capacity of offshore wind generation, the UK offers a useful proxy for evaluating the health of the global industry. In this article, we outline three fundamental growth drivers – generation costs, resource abundance and low technology risks – that give us confidence in a market rebound.
A perfect storm for offshore wind
The wind industry has weathered a challenging couple of years.3 Bad news has proliferated in recent months, with major new projects cancelled or put on ice. The development of both a 1.4GW windfarm in the UK North Sea and a 2.2GW windfarm off the US Northeast coast have both been recently halted. Their respective developers cited short-term challenges from higher interest rates, material costs and supply chain issues that made the projects unviable.4
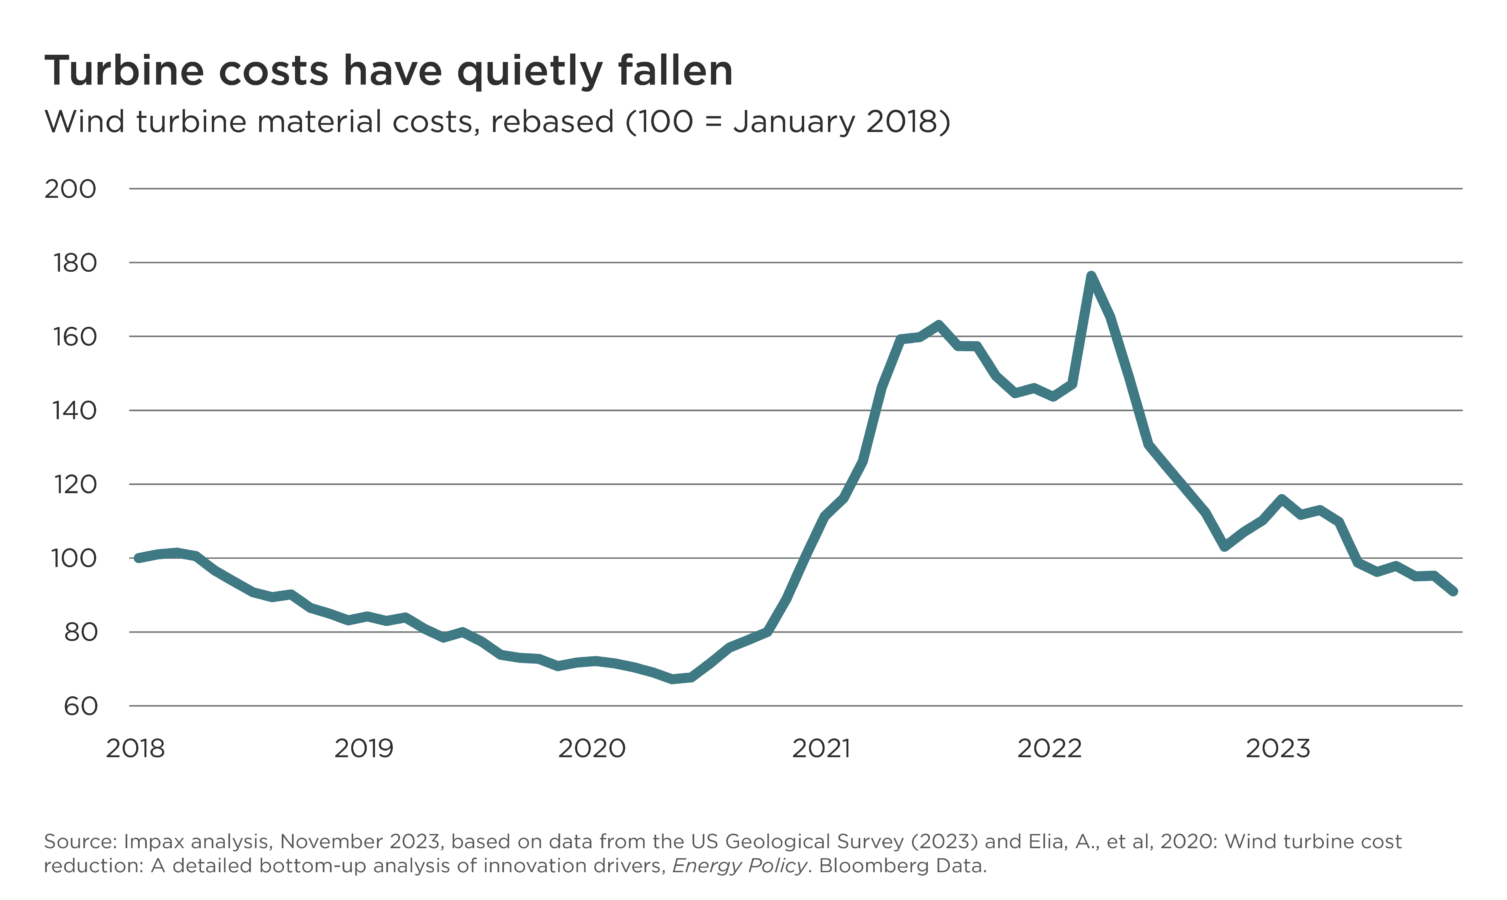
First, rising interest rates have upped costs of capital for developers. New offshore wind projects involve large upfront costs in the form of development rights and capital expenditure in turbines and their installation. Second, the cost of turbines themselves has risen as a function of higher input costs. Based on a weighted estimate of components, we calculate that turbine material costs rose by roughly 75% in the Europe between December 2020 and their peak in March 2022.5 This follows the doubling in the price of steel – heavily used in wind turbine foundations and towers – during this 15-month period. The third challenge has come in the form of stretched supply chains. Recent shortages range from major components to the large, specialised vessels needed to install wind farms at sea.
Rising costs have not been the only determining factor in derailing new projects. Government contracts that fix (and so cap) prices for electricity generated by new windfarms have also contributed. In September 2023, a UK auction of offshore wind locations yielded no bidders.
Why offshore wind will continue to power Britain’s energy transition
Encouragingly for the industry, the UK government has responded by raising the maximum price available to bidders in 2024.6 Policy support is not the only reason for optimism, though. We perceive three fundamental drivers of the offshore wind industry’s long-term growth, in the UK and beyond.
1. Downward cost trends reassert themselves
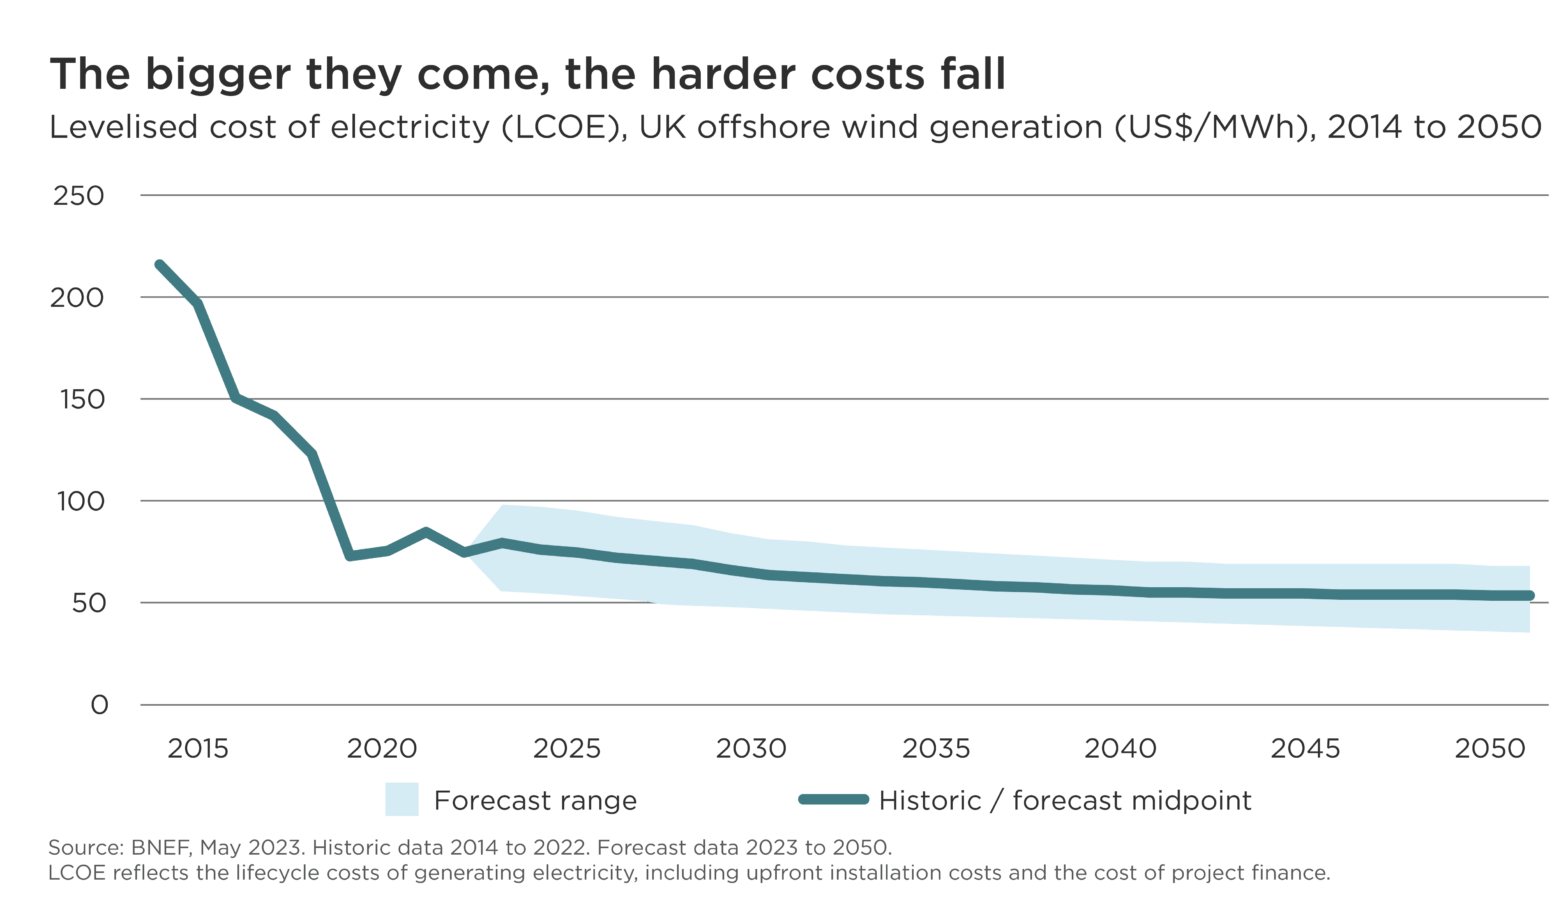
Despite the recent bout of inflation, the long-term trend for industry costs has been deflationary. The lifecycle costs of UK offshore wind generation, as measured by the levelised costs of electricity (LCOE) metric, fell by around two-thirds between 2014 and 2019 as turbines and windfarms scaled up.7
Estimates from BNEF and others project that the trend of falling costs will reassert itself as short-term inflationary drivers subside and the industry continues to benefit from economies of scale and ‘learning by doing’. BNEF estimates that the LCOE of UK offshore wind generation can fall by another one-third by 2040 (see chart below).
Wind turbine material costs have already fallen back from their 2022 peaks. Based on an analysis of input costs, we estimate that, on a weighted basis, the cost of turbine materials has returned to levels seen in early 2018 (see chart below). Global prices for steel – which accounts for roughly three-fifths of turbines’ weight – peaked in March 2022, following Russia’s invasion of Ukraine.8 By November 2023, global steel prices had halved.
Major energy consumers, meanwhile, are demonstrably willing to pay for clean, reliable offshore wind energy as part of their decarbonisation efforts. Corporate power purchase agreements (PPAs) involving renewables, under which companies make long-term commitments to buy electricity directly from a supplier, have taken off in Europe over the past few years. By the end of 2022, 1.4GW of UK offshore wind capacity had been contracted under corporate PPAs.9 Having signed a PPA for 100MW of capacity from a Scottish offshore windfarm operator, Google’s UK operations will be around 90% carbon-free by 2025 when the turbines start generating electricity.10
Higher interest rates – and so, a higher weighted average cost of capital (WACC) for new projects – remain a challenge for the industry. This is not isolated to renewables, however. New oil and gas, coal and nuclear projects will all see project hurdle rates rise on the back of higher borrowing costs. Indeed, the market has recently woken up to the prospect of structurally lower oil and natural gas prices amid structurally higher interest rates, raising the risk of financial strain in the fossil fuel industry in 2024.
2. Offshore wind is an abundant, quality resource
The UK’s leadership in offshore wind owes much to its natural resources. The shallow depth of many coastal waters, especially the North Sea, is ideal for the incumbent bottom fixed offshore wind (BFOW) technology (as opposed to more nascent floating windfarm technologies). Wind speeds are relatively high and consistent. As a result, the average capacity factor of UK offshore wind farms between 2018 and 2022 was 41% (expressed as a percentage of the maximum output possible), versus 27% for UK onshore wind and 11% for UK solar PV.11 BNEF estimates that UK offshore capacity factors for new-build offshore wind are between 51% and 58%, higher than any other nation in the same analysis.12
The UK government projects that larger and more efficient turbines should enable average capacity factors of 57% by 2030.13 These levels of efficiency are already being achieved by a pilot floating offshore windfarm, Hywind Scotland.14
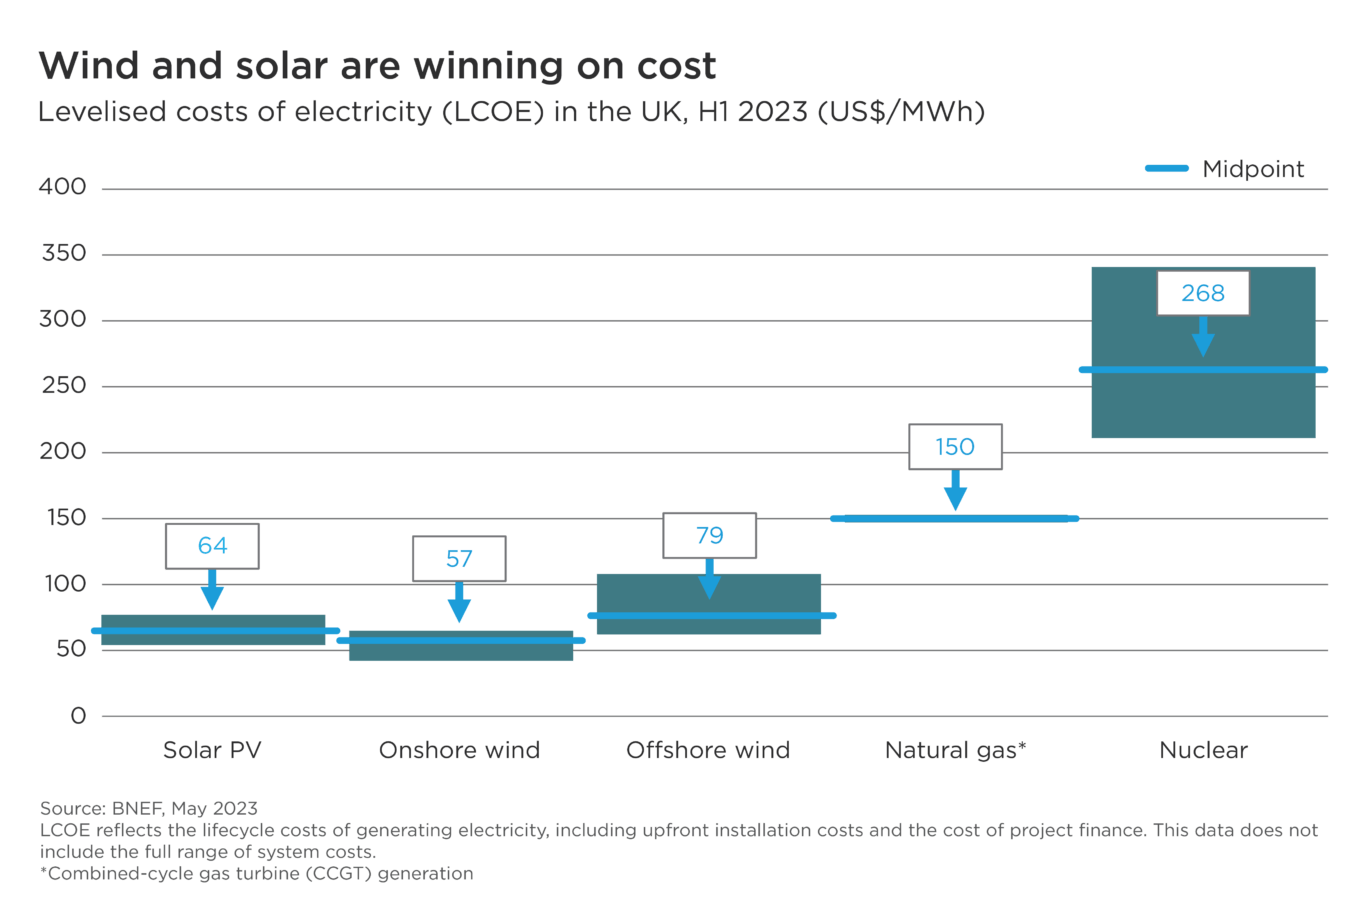
The prospect of even greater capacity factors demonstrates the long-term potential for UK offshore wind to generate electricity at low cost. As demonstrated in the chart below, alongside onshore wind and solar PV, the LCOE of offshore wind was roughly half that of combined-cycle gas turbine generation in the UK in the first half of 2023.
3. TINA (there is no alternative)
The Climate Change Act commits the UK government by law to reducing greenhouse gas emissions to net zero by 2050. Renewable generation at vast scale will be key to enabling cost-effective electrification of the UK economy.
Already, renewables are outcompeting alternative means of electricity generation (see the chart below). The addition of intermittent sources of cheap power, like solar and wind, to the grid involves balancing costs.15 The UK Energy Research Centre has estimated that intermittency costs could be as low as 10% of wholesale power prices, with analysis by the UK government estimating that system costs could be as much as 20%.16,17 LCOE analysis provides a simple way of consistently comparing the costs of different generating technologies, but does not consider a technology’s impact on the wider transmission and distribution system.18 Even taking these additional costs into account, however, the lifecycle cost of renewable power remains superior to the alternatives – including nuclear and natural gas.
Opportunities in a turbulent market
Supply chain issues, cost inflation and unsupportive public policy in key markets like the UK have been well documented, putting downward pressure on wind industry stocks over the past couple of years. We believe this ‘reset’ in company valuations provides grounds for re-evaluating where long-term opportunities lie within the industry.
Although supply chain challenges remain, growth in the offshore wind industry ultimately provides opportunities for wind turbine equipment manufacturers to grow in a competitive environment that is more consolidated than ever. Recent quality issues at Siemens Gamesa, a major turbine maker, highlight how the focus must be on delivering platforms that are operationally reliable, rather than simply pursuing a race to the top in terms of developing larger and larger turbines. While not impervious to product issues caused by a proliferation of model releases five years ago, we believe Vestas looks set to benefit from a promising offshore wind turbine platform and a consolidating market. The Danish company was the second-largest supplier of turbines by capacity globally in 2022.19
Rising offshore activity creates opportunities for segments of the industry like turbine and foundation installation vessels, which remain in short supply. As new offshore windfarms are built, they must be connected to national or regional electricity grids. Parts of the value chain including array and transmission cable providers like Prysmian, as well as other providers of other high voltage equipment and infrastructure, are well-positioned for growing demand as more projects are integrated into the grid. The Italian company is the world’s leading power and optical cable maker by revenue and the largest supplier of cables for the high-voltage transmission market.20 It also installs cables for subsea high-voltage connections to offshore windfarms.
A cornerstone of the clean energy mix
Offshore wind farms will continue to play a more central part in fulfilling energy needs in the UK and other major economies over the course of this decade. They are already a cornerstone of the UK grid, generating 17% of total electricity in 2022, up from 14% in 2021.21
The UK will need sustained double-digit annual growth in new low-carbon power installations to decarbonise its economy and raise resilience to fossil fuel price shocks. Offshore wind capacity must more than treble by 2030 if the UK government is to achieve its target of 50GW.22 Onshore capacity – solar, wind, nuclear and high-efficiency gas turbines – must also ramp up. Diversity of electricity sources, including interconnectors, as well as storage technologies and demand responses are key given the intermittency challenges posed by high renewable generation.
In an evolving UK energy system, cost-competitiveness and abundant natural resources mean offshore wind is the only technology that can provide clean energy at the cost and scale required to power sustainable economic growth. The production profile of UK offshore wind, with higher capacity factors than other intermittent renewables, carries tremendous value in meeting energy demand.
The UK is often portrayed as a special case, due to its scarce land availability and limited sunlight, but there are many economies (including the Netherlands, Germany and parts of the US) where offshore wind is an essential clean energy technology. This reinforces our conviction in the powerful long-term opportunities generated by turbines’ gradual march across coastal horizons.