
Don’t Bet the Ranch: Hit Ratios, Asymmetry and Breadth

This paper discusses our framework for assessing the repeatability of performance, using the concepts of hit ratio, asymmetry and breadth. We believe that strategies predicated entirely on being smarter (i.e. having a very high hit ratio) will tend to disappoint, unless supported by longer track records, a clearly identifiable edge and significant asymmetry in implementation. Strategies that primarily seek breadth, with low hit ratios and no asymmetry, can fare very well for many years but typically run high levels of leverage and correlation risk that can result in unexpectedly large drawdowns, especially during financial crises. We favour approaches that seek to combine the benefits of all three performance drivers (hit ratio, asymmetry and breadth), rather than relying on any one. Such strategies are more likely to generate attractive and repeatable Sharpe ratios that are demonstrably not the result of luck and do not necessitate unreasonably long investment horizons.
Introduction
“Past performance is not indicative of future returns.” This is a pervasive disclaimer, but, in practice, often has little actual influence on decision making. When decomposed and understood appropriately, however, historical returns can provide useful guidance on the robustness of an investment process, the minimum length of track record investors should seek, and an appropriate investment horizon. When making an allocation to an external manager, it is important to understand where value is likely to come from and where the inherent risks lie.
Widely-used performance metrics such as the Sharpe ratio have well-understood limitations, especially for illiquid or short volatility strategies, but generally offer a simple and sensible way to compare performance across strategies.1 Unfortunately, not all equivalent Sharpe ratios are equally valuable or robust. For example, if two strategies offer the same Sharpe ratio but one is far less correlated with equities, it is usually more valuable from the perspective of an investor’s overall portfolio. Additionally, the more confidence one can have that performance is driven by process rather than luck, for example with many small winners rather than a handful of outsized “lucky” bets, the more helpful it should be in terms of forming future expectations.
Decomposing risk-adjusted returns
Many investors will have come across Grinold’s (1989) “Fundamental Law of Active Management”, which popularised the relationship between risk-adjusted returns (information ratio), skill (information coefficient) and breadth (number of independent bets in a year). Based on the fundamental law, Grinold and Kahn (2000) conclude that portfolio managers “must play often and play well to win at the investment management game. It takes only a modest amount of skill to win as long as that skill is deployed frequently.” We are subscribers to this view but find it helpful to further decompose skill into more readily observable and understandable concepts of hit ratio and asymmetry, as defined in Table 1.
In this paper, we develop a simplied model, which derives the expected Sharpe ratio of a strategy assuming a specific hit ratio, asymmetry, breadth, and average correlation between trades. The details of the model are presented in the Appendix. While the framework is highly stylised, it can serve to clarify the interaction between these factors and their impact on expected risk-adjusted performance.
The approach presented here is complementary to the time tested mean-variance approach to portfolio construction. Rather than considering positions at any point in time in order to find the most efficient allocation of risk, we look instead at the performance of individual trades that may span different time frames.
Combining hit ratio and breadth
Making meaningful improvements to the hit ratio can be challenging, but is achievable if a diverse and experienced team follows a disciplined research process. However, given inherent uncertainty associated with investing, there is a limit to which hit ratios can be reasonably increased. Historically, we observe that the managers with low market directionality rarely realise a hit ratio far in excess of 60%; in other words, they get a lot of things wrong but still outperform the majority of their peers over time. Key to translating their hit ratio into strong risk-adjusted returns is breadth, i.e. they are able to repeatedly sustain a hit ratio across many independent ideas.
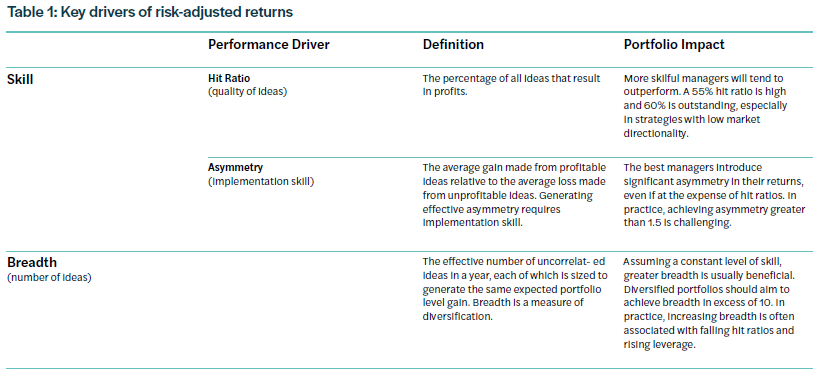
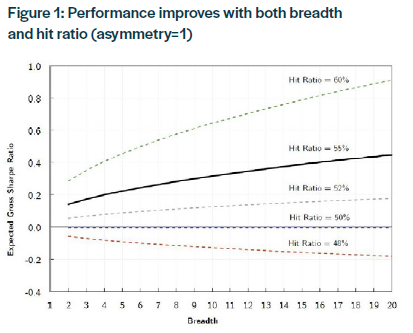
As can be seen in Figure 1, a portfolio with relatively low breadth of, for example, five ideas per year, (ignoring asymmetry for the moment) will struggle to generate impressive Sharpe ratios, unless the manager is exceptionally skilful, i.e. has a hit ratio substantially in excess of 60%. The implication is that managers need to focus on jointly increasing hit ratios and breadth, not solely on getting things right. A manager that relies on an unrealistic hit ratio with limited breadth should be viewed with scepticism.
There are many ways to increase breadth, including adding distinct approaches for idea generation, expanding the investment universe to include additional risk premia factors, focusing on relative value strategies, and exploiting trading opportunities across multiple time horizons. However, increasing breadth will eventually negatively impact the hit ratio as it becomes progressively more difficult to identify profitable ideas (the 20th idea will likely be weaker than the 15th idea, which will likely be weaker than the 5th idea).
The impact of breadth on investment assessment horizon
In assessing the robustness of an investment strategy, it is important to reduce the likelihood that a manager’s performance is simply the result of luck. Unfortunately, gaining statistically significant confidence that a manager is truly skilful can involve unrealistically long assessment horizons. By then, the manager may have reached capacity or retired.
If breadth is interpreted as the number of times a manager makes independent bets, the assessment horizon can be shortened considerably. As a crude rule of thumb, we think it is sensible to wait for at least a year and for the manager to have made at least 20 bets, before looking seriously at their track record as a possible guide to the future. Ideally, 30-40 bets should be analysed. In practice, and all else equal, this implies that a manager with four times the breadth of another requires the investment assessment horizon to be half as long.
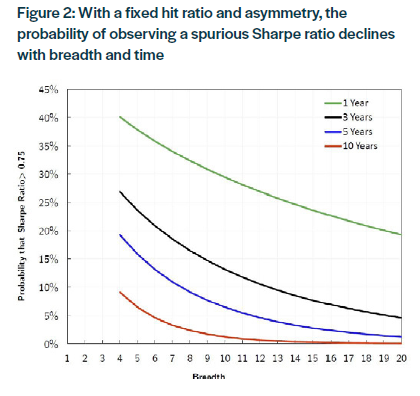
Figure 2 illustrates how a manager with a true Sharpe ratio of 0.5 and breadth of 15 is highly unlikely (8%) to generate a Sharpe ratio of greater than 0.75 over three years; in light of the law of large numbers, he is playing too many times for luck to overly influence the result.
On the other hand, a similarly skilled manager (having the same hit ratio and asymmetry) with breadth of 5 is much more likely (24%) to generate the same Sharpe ratio over a three year period, highlighting the greater role of luck when judging low breadth strategies over short periods of time. Importantly, without transparency on breadth, track record comparisons are less meaningful. Such analyses require managers to provide detailed information on the size, timing and performance of each of their trades. In turn, this requires them to have the necessary infrastructure to maintain all relevant records.
Extreme breadth and the risk of failure
So far, we have assumed that the average correlation between ideas is zero, which is not easy to achieve in practice. For breadth to really add value, it is important that this correlation assumption is not compromised, especially for high levels of breadth. For example, assuming a hit ratio of 55% and asymmetry of 1.5, the value from breadth greater than 15 is negligible if the average correlation rises to 0.1. Similarly, the value from breadth greater than 10 is negligible if the average correlation rises to 0.2.
Substantial increases in breadth are usually associated with high turnover, high leverage or both. In the case of high leverage, underlying exposures may well be generated independently using uncorrelated approaches, but they do share leverage as a common factor. If this is removed at short notice, for example during a financial crisis, generalised position liquidation will likely result in correlations spiking and hit ratios falling.
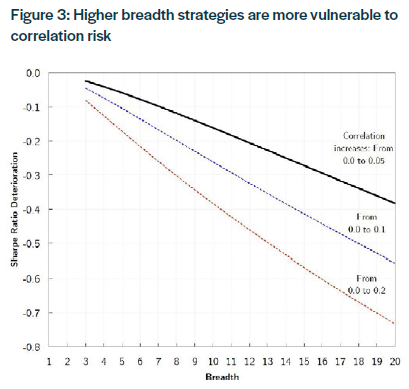
As illustrated in Figure 3, even small rises in correlations can destroy the Sharpe ratios of strategies with apparently high breadth, even in the absence of hit ratio deterioration. It is for this reason that first in 2007 and then in late 2008, many highly leveraged strategies with extraordinary breadth suffered near death experiences or failed (see Khandani and Lo, 2008).
The risks associated with high leverage are low from a probability perspective, but are real and tend to be catastrophic when they materialise. Fortunately, significant gains from breadth can be achieved with limited leverage. Once these have been exhausted, it is often safer to seek further improvement through asymmetry, where the marginal improvements in the Sharpe ratio can be very significant, but without the same failure risk that is associated with higher levels of leverage.
Introducing asymmetry
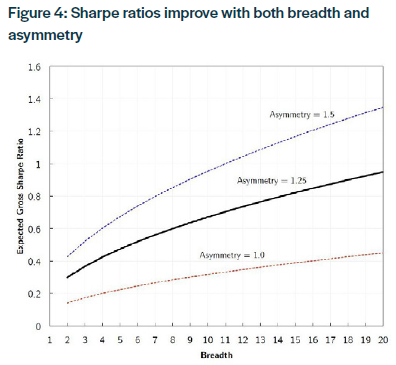
Asymmetry can be expressed as the average profitability of winning ideas versus the average loss made on losing ideas. Assuming an achievable, but still impressive, hit ratio of 55%, Figure 4 illustrates the joint impact that breadth and asymmetry can have on the expected Sharpe ratio. For a given hit ratio, the expected Sharpe ratio increases with breadth and asymmetry, albeit at decreasing rates.
Asymmetry is most typically introduced into portfolios through the purchase of options, by employing stop losses or employing trend-following strategies. Unfortunately, the introduction of asymmetry is not straightforward and the benefits can easily be reversed through a reduction in the hit ratio as there is usually either an explicit (time decay and the volatility risk premium associated with options) or implicit (whipsaw risk associated with stop losses and trend-following strategies) cost.
One possible exception is to focus on `margin of safety’ by investing in cheap or distressed securities as a means to increase asymmetry; for example, companies on the brink of bankruptcy can only lose 100% of their value, but can increase many-fold. However, such investments tend to be highly volatile and typically require strong stomachs and long investment horizons.
Overall, the successful introduction of asymmetry requires implementation skill, most importantly with regard to option usage and trading techniques, which is distinct from an ability to generate ideas. Rather than seeking managers with the highest hit ratio, investors should try to identify managers who possess a combination of high hit ratio, asymmetry and breadth. The less constrained the manager, the more likely he will be able to use all three levers to generate attractive, risk-adjusted returns.
Illustrative example of the impact of hit ratio, asymmetry and breadth
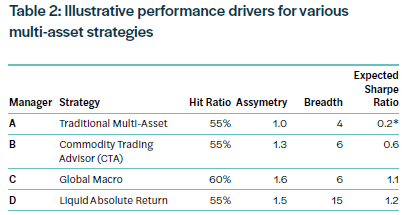
In the absence of trade-by-trade attribution, the example in Table 2 uses the monthly returns of different multi-asset approaches to crudely estimate their hit ratio (percentage of winning months) and asymmetry (size of the average winning month relative to the average losing month). Since breadth is difficult to glean from monthly returns, we instead imply breadth using the other estimated parameters and the realised Sharpe ratio, which is known. A much more accurate picture could be obtained using actual trade-by-trade data, which we do for our own portfolios.
We estimated the hit ratio, asymmetry and breadth of four multiasset strategies, and these are shown in Table 2.
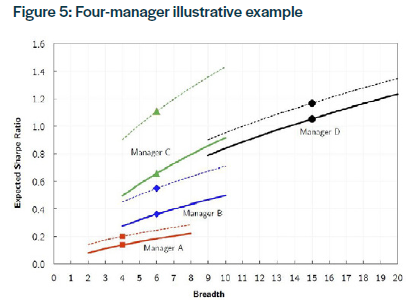
Manager A is a traditional, long-only, multi-asset manager with a hit ratio of 55%. Limited to a long-term investment horizon and constrained on leverage, he is able to identify four independent ideas in a year. Due to constraints on turnover and option usage, he is unable to implement with asymmetry. His expected gross information ratio is 0.2 on top of his benchmark. Given his breadth, he needs a hit ratio of 72% to generate a Sharpe ratio of 1; history would suggest this to be an unrealistic long-term target for any manager.
Manager B is a Commodity Trading Advisor (CTA) that does not use options. However, trend-following represents a large part of his strategy and allows him to implement with asymmetry of 1.3 (losing trades are cut quickly and winning trades are left to run), while increasing breadth to 6 and maintaining a hit ratio of 55%. His expected gross Sharpe ratio is 0.6 but fees reduce the net Sharpe ratio to 0.4.
Manager C is an unconstrained global macro manager with substantial resources and options expertise that enable him to increase his hit ratio to 60%, while delivering an asymmetry of 1.6. Given his high conviction levels, he is content with maintaining breadth at 6. His expected gross Sharpe ratio is 1.1, but fees reduce the net Sharpe ratio to 0.7.
Manager D is a similarly unconstrained, liquid absolute return manager that jointly seeks to increase hit ratio, asymmetry and breadth. However, as he adds more ideas, he is unable to maintain his hit ratio or asymmetry as high as Manager C. With a hit ratio 55%, asymmetry of 1.5 and breadth of 15, his expected gross Sharpe ratio is 1.2. Low fees result in a net Sharpe ratio above 1.
Of these four managers, we believe that manager D is most likely to achieve a consistent and attractive long-term Sharpe ratio, with limited use of leverage, since he generates value from all three performance drivers. Furthermore, relatively high breadth should allow him to demonstrate true skill more quickly than the other managers (he plays more often), while relatively low fees reduce carrying costs.
Conclusion
In the absence of better information, analysing monthly, weekly, or daily returns can provide some guidance on the inherent hit ratio, asymmetry and breadth embedded in a strategy. Clearly, this is a simplification and ignores trade-idea generation and sizing aspects, which are not necessarily distributed uniformly over time.
Attribution data that decompose aggregate returns into contributions from individual ideas provide a more powerful tool to assess the extent to which past performance may be indicative of the future. From such data, a better understanding of hit ratio, asymmetry and breadth can be achieved, resulting in a more accurate forecast of future performance.
Strategies that are predicated entirely on being smarter or having a very high hit ratio will tend to disappoint. Such strategies can be attractive, but should ideally be supported by longer track records, (their lack of breadth means that they need more time to prove their skill), a clearly identifiable edge and significant asymmetry in implementation to offset their concentration risk.
Strategies that primarily seek extreme breadth, with low hit ratios and no asymmetry, can fare very well for many years but typically run high levels of leverage and are exposed to correlation risk that can result in unexpectedly large drawdowns. Such strategies can have a useful role in portfolios, so long as tail risks are acknowledged appropriately when sizing allocations. However, as compensation for the risk of failure associated with high levels of leverage, investors should look for exceptional Sharpe ratios from such strategies.
While any given Sharpe ratio can be generated by an infinite number of combinations of hit ratio, asymmetry and breadth, strategies that focus on managing their investment process with regard to these three drivers of performance quality are most likely to generate attractive and repeatable Sharpe ratios that are demonstrably not the result of luck. They are also less likely to require high levels of leverage that can become problematic during financial crises. Where possible, investors should try to understand the relative importance of each of these drivers in a manager’s investment process and track record. We have no preference for any one of the performance drivers; after a point all three likely suffer from diminishing returns and increasing risks. Rather, we advocate their joint use as this can result in a highly effective investment strategy.
Read the full article here.
1. Our favoured performance metric is the ratio of annual return to maximum drawdown(s) as this is more broadly applicable across strategies, including those that are short volatility or involve illiquidity risk.