
Australian Small-Caps – The Active Difference

Summary
1) The historical outperformance of small-cap stocks versus large-caps has dissipated over the last 30 years; small-caps no longer outperform simply because they are small.
2) Structural inefficiencies in the small-cap market, however, result in greater mispricing, offering an ideal opportunity for active managers to leverage stock selection skill.
3) This means that for Australian small-caps, active management stands out as the most effective approach – with Lennox Capital Partners’ focus on exploiting the mispricing of change on company earnings, which has driven a long-term record of benchmark outperformance, representing one successful example.
When the academic Rolf Banz first identified a size effect – or an additional return generated by small market-capitalisation (“small-cap”) companies relative to their larger peers – in 1981, he concluded his research with a caveat:
“The size effect exists but it is not at all clear why it exists. Until we find an answer, it should be interpreted with caution. It might be tempting to use the size effect … [but] naturally, this might turn out to be complete nonsense if size were to be shown to be just a proxy." 1
As with any successful investment idea, the discovery of the size effect initially spawned the launch of a host of small-cap funds. But no sooner than its discovery was announced did the effectiveness of the size effect begin to deteriorate. One explanation was that the newly created investor demand raised the prices of small-cap firms, resulting in lower future returns2; later research would instead contend that firm size was in fact a proxy for liquidity risk, as Banz had cautioned, and that as small-cap funds increased the liquidity of such companies, they undermined ‘size’ as a return driver3. Whatever the cause, the size effect had dissipated to such an extent that by 2011, the academics Eugene Fama and Kenneth French, who had themselves popularised firm size as a factor in their three-factor model in the early 1990s4, found no evidence of a size premium in any of four global developed market regions, across 23 countries, in the period from 1990 to 20105.
Similarly, Australian investors can observe that the small-cap S&P/ASX Small Ordinaries Index has meaningfully underperformed the large/mid-cap S&P/ASX 100 Index since the initiation of both indices in August 2000 (Chart 1).
Chart 1: Relative performance of the S&P/ASX Small Ordinaries Index, versus the S&P/ASX 100 Index, August 2000 to June 2025
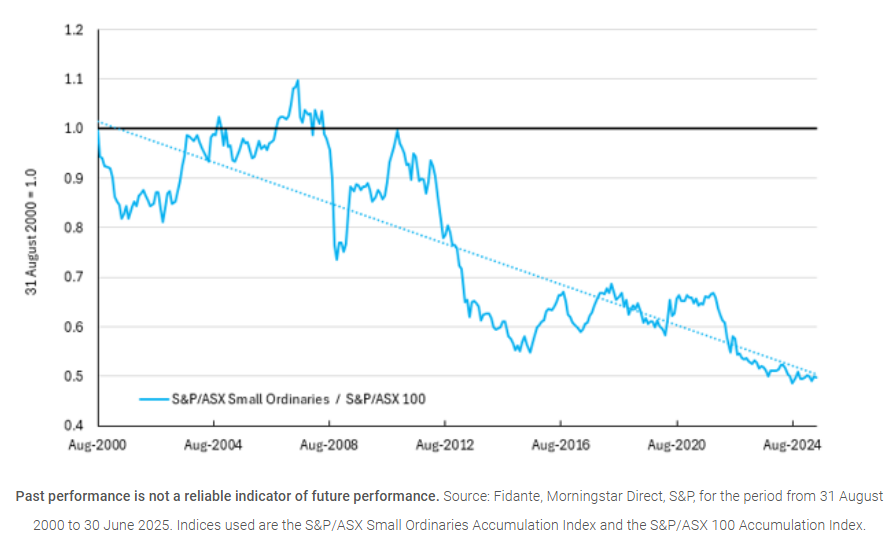
Collectively, these results suggest that there is no longer any meaningful size effect – in other words, that small-cap stocks no longer outperform simply because they are small – and that a passive investment approach is not suitable for the asset class. However, there remains a strong case for an allocation to Australian small-caps where it is actively managed.
The active difference
A notable feature of small-cap investing is the higher level of market inefficiency, including limited analyst coverage, higher information asymmetry surrounding operational performance, and potentially higher transaction costs including trade implementation difficulty. These inefficiencies result in greater mispricing among small-caps, relative to large-cap firms, and for active managers able to efficiently exploit this mispricing in a repeatable way, there is a significant opportunity to generate alpha through stock selection.
The investment team at Lennox Capital Partners, for example, employ an active approach based on the belief that structural, cyclical or company specific change is mispriced by the market in the short-term. By adopting a medium-term investment horizon and independently forecasting company earnings, as well as directly engaging with company management, Lennox seeks to identify high-quality companies with sustainable earnings and exploit this mispricing.
Since inception in April 2017, this approach has resulted in the Lennox Australian Small Companies Fund not only outperforming its benchmark S&P/ASX Small Ordinaries Accumulation Index by +3.1% p.a., net of fees (as at 30 June 2025), but also the S&P/ASX 100 Index (Chart 2).
Chart 2: Relative performance of the Lennox Australian Small Companies Fund, after fees, and S&P/ASX Small Ordinaries Index, versus the S&P/ASX 100 Index, April 2017 to June 2025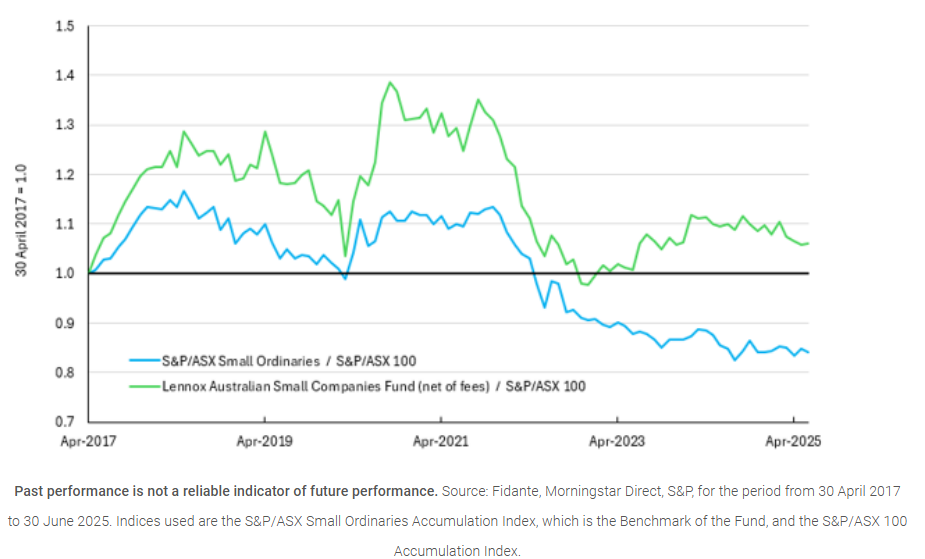
In combination, the absence of a generic return premium for Australian small-cap stocks, alongside the potential for significant alpha generation via a robust and repeatable, active investment approach, highlights the importance of selecting the right Australian small-cap manager to complement existing portfolio exposures. With over 50 years of collective investment experience, the Lennox investment team has produced a strong track record of benchmark outperformance for investors.
Author: James Clark
1Banz, R. W. (1981), ‘The relationship between return and market value of common stocks’, Journal of Financial Economics 9(1), 3-18.
2Crain, M. A. (2011), ‘A literature review of the size effect’, working paper, The Financial Valuation Group.
3Ibid.
4Fama, E. F. & French, K. R. (1993), ‘Common risk factors in the returns on stocks and bonds’, Journal of Financial Economics 33(1), 3-56.
5Fama, E. F. & French, K. R. (2012), ‘Size, value, and momentum in international stock returns’, Journal of Financial Economics 105(3), 457-472.
Disclaimer:
This material has been prepared by Lennox Capital Partners Pty Limited (ABN 19 617 001 966) (AFSL 498737) (Lennox), the investment manager of Lennox Australian Small Companies Fund (Fund).
Fidante Partners Limited ABN 94 002 835 592 AFSL 234668 (Fidante) is a member of the Challenger Limited group of companies (Challenger Group) and is the responsible entity of the Fund. Other than information which is identified as sourced from Fidante in relation to the Fund, Fidante is not responsible for the information in this material, including any statements of opinion.
It is general information only and is not intended to provide you with financial advice or take into account your objectives, financial situation or needs. You should consider, with a financial adviser, whether the information is suitable to your circumstances. The Fund’s Target Market Determination and Product Disclosure Statement (PDS) available at www.fidante.com should be considered before making a decision about whether to buy or hold units in the Fund. To the extent permitted by law, no liability is accepted for any loss or damage as a result of any reliance on this information.
Past performance is not a reliable indicator of future performance.
Any projections are based on assumptions which we believe are reasonable but are subject to change and should not be relied upon.
Lennox and Fidante have entered into arrangements in connection with the distribution and administration of financial products to which this material relates. In connection with those arrangements, Lennox and Fidante may receive remuneration or other benefits in respect of financial services provided by the parties.
Investments in the Fund are subject to investment risk, including possible delays in repayment and loss of income or principal invested. Accordingly, the performance, the repayment of capital or any particular rate of return on your investments are not guaranteed by any member of the Challenger Group.