
The Case for Infrastructure

MEGA TRENDS
The utility sector is undergoing a structural transformation, driven by a surge in electricity demand tied to the convergence of several powerful macro trends. The explosive growth in energy consumption from data centres, AI, industrial reshoring and broader electrification efforts is at the forefront of this transformation. What was once a sector characterised by modest, predictable growth has now entered a period of rapid acceleration.
Figure 1: Electricity Demand – IEA Forecast
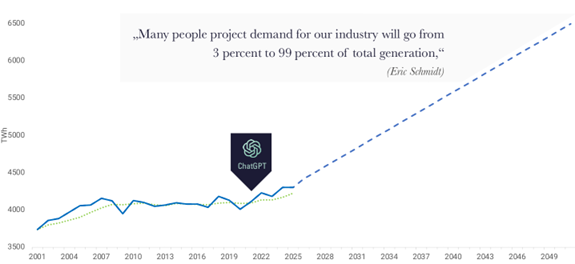
Source: IEA Forecast: Electricity 2025 – Analysis - IEA
In response to this tidal wave of demand, U.S. utilities are revising earnings and capital expenditure forecasts upwards. Entergy, IDACORP and Xcel Energy, for example, have increased their five-year capital plans by double digits, reflecting a robust investment pipeline in generation, transmission and grid modernisation. This demand is not just theoretical — it is materialising right now, with utilities signing long-term contracts with hyperscalers and manufacturers.
The reshoring of manufacturing and the boom in digital infrastructure are concentrated primarily in the southern and midwestern United States, where electricity demand is rising sharply. Regulated utilities operating in these regions are well placed to benefit from this, as they can rely on predictable rate-based returns to support long-term capital deployment. Additionally, natural gas and nuclear power are being prioritised again as reliable, controllable sources of energy to complement renewable energy generation. The deployment of small modular reactors (SMRs) is gaining momentum, with companies such as Duke and Dominion actively planning to integrate them into their future capacity mixes.
From a policy perspective, infrastructure continues to enjoy bipartisan support in the US, with the Inflation Reduction Act (IRA) providing long-term investment certainty, particularly in states that traditionally vote Republican. Even amid political shifts, key elements such as tax credits for renewable energy are expected to endure. In Europe, parallel momentum is building. Germany’s €1 trillion infrastructure and defence plan, alongside the EU’s Action Plan for Affordable Energy, is catalysing investment in energy reliability and decarbonisation, particularly in response to recent energy security issues and power cuts.
Together, these trends are transforming the role of utilities from low-growth, defensive income providers into dynamic enablers of the energy transition, the digital economy and industrial revival. The current environment offers a rare combination of policy tailwinds, secular growth and visibility on earnings expansion, creating a compelling backdrop for long-term investment opportunities in listed utility infrastructure.
THE MACRO PERSPECTIVE
Positioning for Resilience: The Case for Defensive Infrastructure in a Shifting Macro Landscape
As the US economy enters the second half of 2025, institutional investors are navigating a particularly nuanced macro environment. The latest data indicates a shift towards a late-cycle phase: economic growth is slowing, inflation remains above target and, while the labour market remains resilient, it is showing signs of moderation. Against this backdrop of change, companies offering stability, income and inflation protection are well positioned, as portfolio resilience is in high demand.
The economic narrative has shifted notably in recent months. Real GDP contracted by 0.5% in the first quarter — its first quarterly decline in over three years — raising concerns about the sustainability of the post-pandemic expansion. Although the Atlanta Fed’s GDPNow model still predicts a rebound in the second quarter with an estimated growth rate of 2.5%, the outlook remains fragile and subject to downward revision. Consumer spending has slowed, public-sector investment has waned, and businesses are managing inventories cautiously. Together, these signals reflect an economy that is no longer running on momentum but adjusting to tighter financial conditions and ongoing global uncertainty.
The labour market remains one of the few pillars of strength. In May, nonfarm payrolls increased by 139,000, with the unemployment rate holding steady at 4.2%. However, private payrolls have weakened, and downward revisions to previous months' figures suggest that the period of robust hiring may be over. While this cooling is not alarming, it indicates that the labour market may no longer be strong enough to drive growth independently, especially if consumption continues to slow down.
On the inflation front, however, the data is more positive. Headline CPI rose by 2.4% year-on-year in May, while core inflation remained at 2.8%, suggesting that inflation is gradually cooling down. Importantly, the pace of monthly increases has moderated, giving the Federal Reserve more flexibility. Nevertheless, inflation remains above the Fed’s 2% target, and recent tariff-related developments have introduced renewed upside risks. In short, inflation is improving, but it is not yet under control.
Another important factor is interest rate sensitivity. Although infrastructure is generally considered to be capital intensive and susceptible to rising rates in the short term (as regulated assets are eventually able to recover higher financing costs through higher rates), the current situation is different. With inflation moderating and growth slowing, the probability of Federal Reserve rate cuts in the second half of the year has increased significantly. If this happens, infrastructure equities — particularly regulated utilities — stand to benefit from lower discount rates and more favourable financing conditions. This could provide a supportive tailwind for valuations.
In Europe, the macroeconomic outlook is becoming increasingly reflationary, particularly following Germany's announcement of infrastructure investment programmes averaging 10% of GDP over the next five years. Strong government support for green infrastructure, digital transformation and improved interconnectivity is providing significant tailwinds for certain sectors. However, ongoing economic and political uncertainties in some countries, such as upcoming elections and inflation concerns, continue to weigh on investor sentiment and valuations.
Following the rebound in the equity market in Q2 2025, valuations have expanded again, particularly in the growth and technology sectors. This has left many areas of the market looking fully priced relative to their underlying fundamentals. Although investor sentiment has improved amid hopes of a soft landing and eventual Fed easing, the sharp recovery has eroded the valuation cushion that existed earlier in the year.
In this context, infrastructure continues to stand out as an investment opportunity. Despite its defensive profile, much of the listed infrastructure universe continues to trade at reasonable multiples, especially when adjusted for quality and earnings durability. Investors can still find high quality businesses that generate cash — many of which have inflation-linked revenues and regulatory stability — at valuations that remain compelling relative to the broader market.
In summary, the current macro environment, characterised by slowing growth, persistent but cooling inflation, and a cautious Federal Reserve, could be conducive to defensive assets. Listed infrastructure provides a rare combination of resilience, income and inflation linkage. In an era of uncertain market leadership and paramount risk management, defensive infrastructure emerges as a reliable source of stable, risk-adjusted returns in an increasingly unstable world.
The Dynamics of the US Macroeconomic Cycle
As part of our investment process, we synthesise a range of critical economic indicators to construct a comprehensive business cycle. These indicators include sentiment analysis, stock market trends, inflation rates, supply and demand dynamics, labour market conditions, and industrial activity data. Examining these variables simultaneously gives us a multidimensional understanding of the economic forces at play and their direct impact on risk assets.
Sentiment analysis provides valuable insights into investor confidence and market perceptions, both of which are essential in understanding broader equity markets and defensive sectors such as core infrastructure.. Stock market trends offer a real-time reflection of the financial health and investor outlook across industries. We examine inflation rates for their impact on purchasing power, input costs, and investment decisions. Supply and demand metrics and outlook shed light on current and future operational challenges and emerging opportunities in the fast changing economic and environmental landscape for core infrastructure companies. Labour market conditions and union agreements are particularly important given it is a key variable for infrastructure companies across the sectors. Finally, data on industrial activity is a key driver of growth for core infrastructure companies as it helps us assess the broader macroeconomic environment in which these companies operate.
Our aim in integrating these diverse yet interrelated indicators is to provide a comprehensive view of the business cycle as it relates to core infrastructure and broader equity markets. This approach enables us to capture the complex interplay of economic factors and their collective impact on listed infrastructure sectors, particularly for more GDP sensitive infrastructure companies. This approach is designed not only to understand the current situation, but also to forecast future trends and potential market shifts.
Table 1 below provides a detailed list of the variables we use for our Economic Cycle Indicator.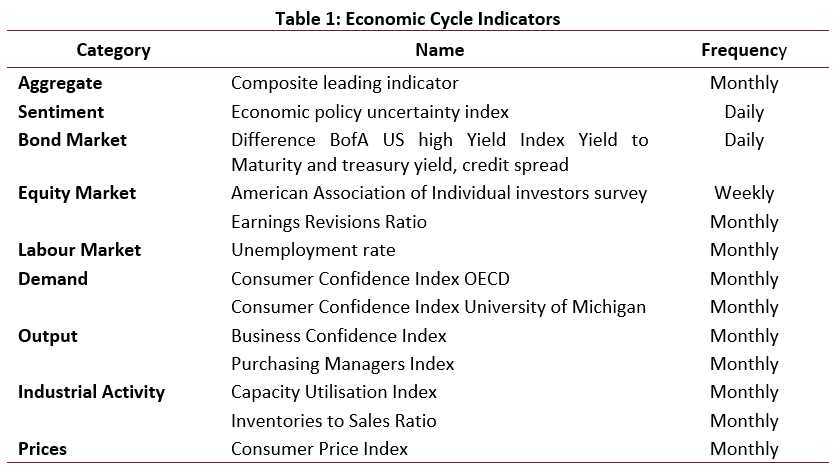
In our analysis of the business cycle, we divide it into four distinct phases: recovery, boom, slowdown and recession. The 'recovery' phase marks the period of growth and recovery following a downturn. It is characterised by increasing economic activity and investor optimism. This is followed by the 'boom' phase, during which we observe peak economic performance, increased consumer spending and substantial corporate profits. Next comes the 'slowdown', when growth slows and market sentiment changes, often signalling caution. Finally, the 'recession' phase is characterised by a significant decline in economic activity, reduced consumer spending and lower levels of investment, as well as often a fall in share prices. Understanding these phases enables us to better interpret the current economic landscape and anticipate future market movements, particularly during periods of political uncertainty.
In our exploration of the phases of the economic cycle and their impact on the stock market, we examine the effectiveness of different style factors in these environments. Our analysis shows that certain types of stocks tend to outperform during periods of robust economic growth. During this phase, small-cap, high-beta and low-profitability stocks tend to outperform, benefiting from general market optimism and growth. Conversely, during periods of economic slowdown, investor preference shifts significantly. During these periods, there is a noticeable shift towards large-cap stocks, which tend to be more stable and well-established. Additionally, stocks characterised by high profitability and low risk become more favoured. This shift reflects a more cautious approach to investing, where stability and reliability are valued amid economic uncertainty.
Figure 2: Cumulative Performance – Cyclicals vs Defensives
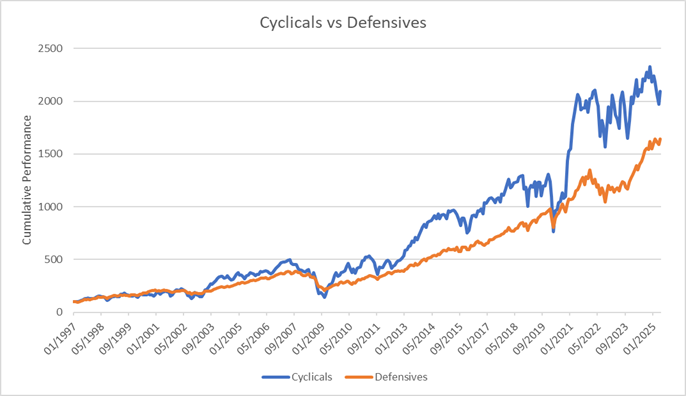
Source: Factset
As shown in Figure 3, during the boom phase, the market usually offers investors high annual returns. However, these lucrative returns come with considerable volatility and a high standard deviation, reflecting the risks associated with a rapidly expanding economy. Despite these risks, a Sharpe ratio of 0.44 suggests that, while they do not fully mitigate the volatility, the returns still offer reasonable compensation for the risks taken.
Stocks that perform well during an economic slowdown experience a significant decrease in returns and volatility. Annual returns fall slightly to 11.3%, reflecting the market's muted enthusiasm. This is reflected in a lower annual standard deviation, indicating a more cautious approach by investors. The Sharpe ratio rises to 0.84 in this phase, suggesting that risk-adjusted returns are more favourable than in the boom phase.
During the recession cycle, stocks continue to show lower returns, which, while lower, are still indicative of resilience in the face of economic contraction. Volatility remains subdued, with a standard deviation of 12.7%, which underlines the ongoing uncertainty of this period. Nevertheless, the relatively high Sharpe ratio of 0.74 suggests that investors can still find good risk-adjusted opportunities amid economic downturns.
In the recovery phase, the market regains momentum, with annual returns rising to 10.5%. However, this rebound is accompanied by the highest volatility of all the phases, with a standard deviation of 29.0%, reflecting the market's search for a new equilibrium. The Sharpe ratio is the lowest of all the phases, indicating that the higher volatility somewhat overshadows the improved returns.
We define cyclical stocks as those with an average performance in the recovery and boom phases, while defensive stocks are those with an average performance in the recession and slowdown phases.
Figure 3: Performance Comparison – Cyclicals vs Defensives
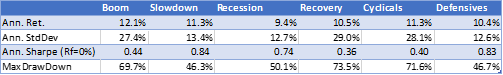
Source: Factset
Figure 4 shows that the US macro cycle is expected to turn negative again in 2024–25, indicating a clear shift from slowdown to recession. This supports a more defensive investment strategy, including increased exposure to low-cyclical sectors such as infrastructure. This is particularly pertinent given the chart's proven track record in identifying macroeconomic turning points. The visual evidence of cycle deterioration further supports the idea that markets may be underestimating how long the current macro weakness will persist.
Figure 4: US Business Cycles
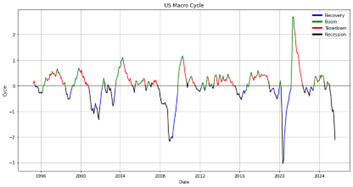
Source: Factset
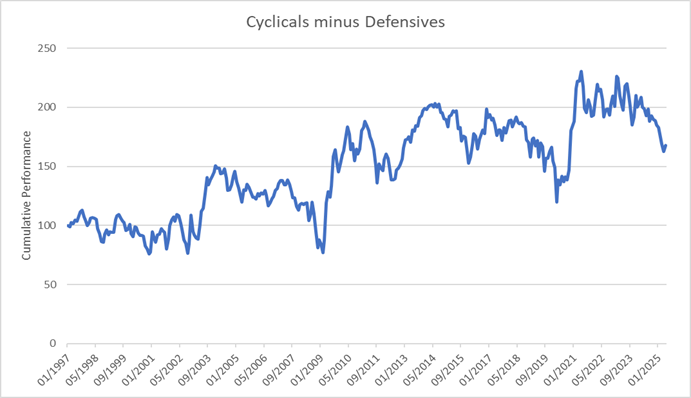
Figure 5, which shows 'Cyclicals minus Defensives', represents the difference in performance between cyclical and defensive equities. This is a key indicator of market risk appetite and economic expectations.
The chart reveals a notable deterioration in the performance of cyclical stocks relative to defensive sectors in recent months. Having previously shown signs of optimism about economic expansion, the spread has narrowed sharply and, in recent weeks, turned negative, indicating that defensive stocks are now outperforming cyclicals.
Figure 5: Cyclicals minus Defensives
Source: Factset, Fred
This shift in leadership reflects growing concerns about the macro environment.
- The underperformance of cyclical sectors, such as consumer discretionary, industrials, and financials, signals that investors are becoming increasingly sceptical about continued economic expansion. This aligns with the recent Q1 GDP contraction and downward revisions to Q2 forecasts. Markets appear to be repositioning portfolios for slower growth or a potential recession.
- The relative outperformance of defensive sectors, such as utilities, consumer staples and healthcare, suggests a classic risk-off rotation. Investors are seeking earnings stability and lower volatility in the face of rising uncertainty around inflation, interest rates, and global trade policy. This rotation typically precedes or coincides with late cycle behaviour.
- This relative performance trend confirms that markets are already anticipating a more defensive stance. Sectors and strategies that are less exposed to the economic cycle, such as regulated infrastructure, utilities and core real assets, align with both macro fundamentals and evolving market sentiment.
The chart clearly shows growing macro caution. As the economic cycle matures and leading indicators soften, investors are moving decisively away from cyclicality and towards defensiveness.
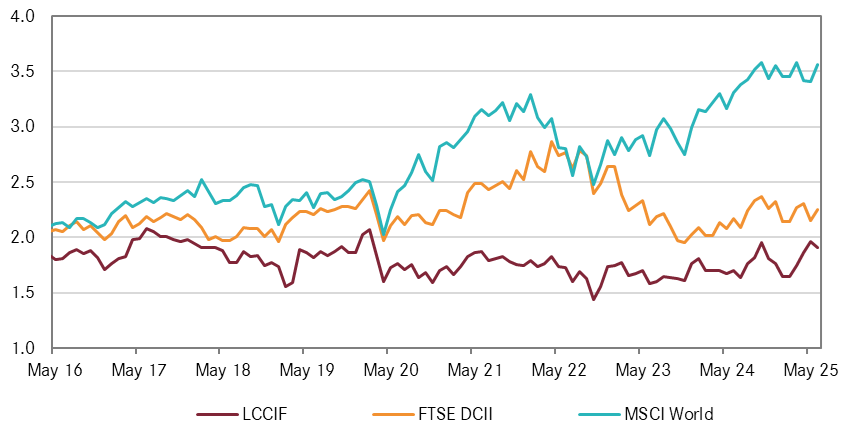
QUALITY AT A FAIR PRICE
Despite its traditionally defensive and cash generating characteristics, core infrastructure listed companies are currently trading at a significant discount to the MSCI World Index and the FTSE Developed Core Infrastructure Index. This suggests that the market is undervaluing the long term stability, inflation protection and essential nature of core infrastructure assets. For institutional investors seeking resilient income, inflation linkage and portfolio diversification, now is a good time to enter a high-quality asset class that is set to benefit from structural trends such as the transition to cleaner energy, the expansion of digital infrastructure and climate adaptation.
Listed infrastructure currently trades at a significant valuation discount of 20–40%, relative to both global equities and comparable private infrastructure assets. While private core infrastructure transactions typically occur at enterprise value-to-EBITDA (EV/EBITDA) multiples of 15–25x, listed core infrastructure is trading at just 11.2x. This valuation gap persists despite listed and private infrastructure often involving similar underlying assets, with listed vehicles often offering better transparency, governance and liquidity.
The discount is driven more by differences in valuation timing and the perceived volatility of public markets than by fundamental differences in asset quality. Historically, long-term returns from listed infrastructure have been broadly comparable to those from private markets. However, listed infrastructure offers superior liquidity, more flexible capital deployment and daily pricing transparency. With record levels of unallocated capital ('dry powder') in private infrastructure funds, listed infrastructure is a cost-effective and timely alternative for institutional investors seeking exposure to essential, inflation-linked, long-duration infrastructure assets.
Chart 1: Valuation Multiples - EV/EBITDA
Source: PATRIZIA, Bloomberg
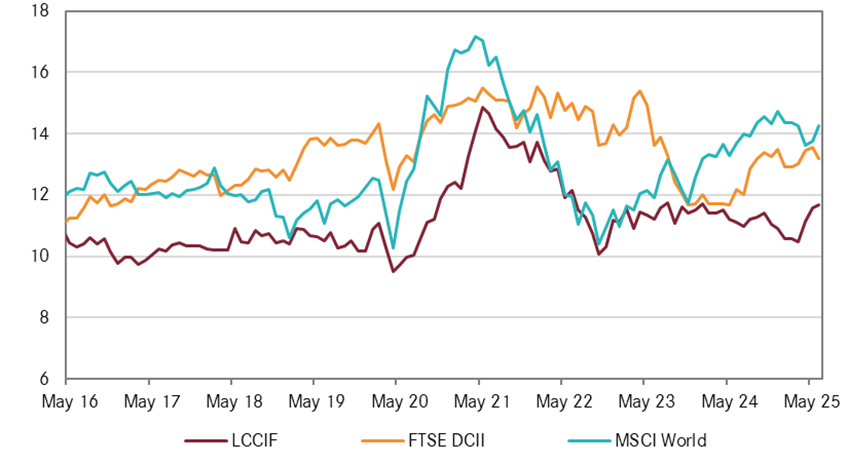
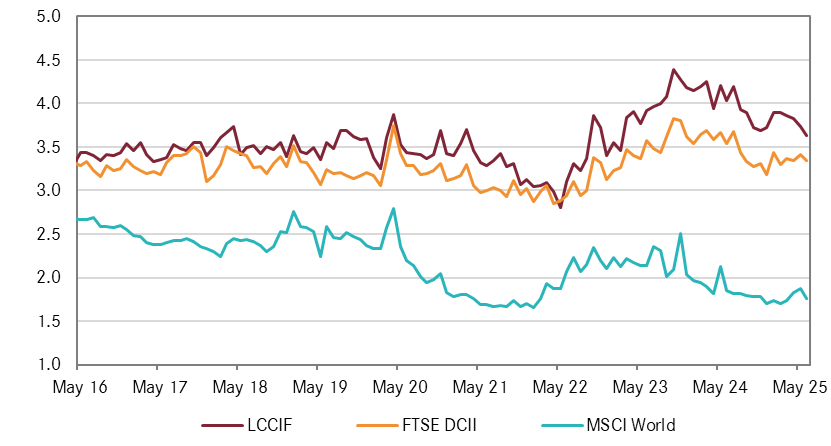
As the next chart shows, listed infrastructure currently offers a significantly higher dividend yield than both the MSCI World and the FTSE Developed Core Infrastructure Index. This persistent yield premium highlights the strong income-generating potential of the asset class, which is underpinned by regulated and contracted revenue streams. Likewise, the price to book multiple shows that listed infrastructure is trading at a significant discount relative to the MSCI World Index.
Chart 2: Valuation Multiples – Dividend Yield
Source: PATRIZIA, Bloomberg
Chart 3: Valuation Multiples – Price to Book
Source: PATRIZIA, Bloomberg
IMPORTANT INFORMATION
This material has been prepared by PATRIZIA Pty Ltd (PATRIZIA) (ACN 008 636 717). PATRIZIA is the holder of an Australian financial services licence AFSL 244434 and is regulated under the laws of Australia.
This document does not relate to any financial or investment product or service and does not constitute or form part of any offer to sell, or any solicitation of any offer to subscribe or interests and the information provided is intended to be general in nature only. This should not form the basis of, or be relied upon for the purpose of, any investment decision. This document is not available to retail investors as defined under local laws.
This document has been prepared without taking into account any person's objectives, financial situation or needs. Any person receiving the information in this document should consider the appropriateness of the information, in light of their own objectives, financial situation or needs before acting.
This document is provided to you on the basis that it should not be relied upon for any purpose other than information and discussion. The document has not been independently verified. No reliance may be placed for any purpose on the document or its accuracy, fairness, correctness or completeness. Neither Ardea nor any of its related bodies corporates, associates and employees shall have any liability whatsoever (in negligence or otherwise) for any loss howsoever arising from any use of the document or otherwise in connection with the presentation.